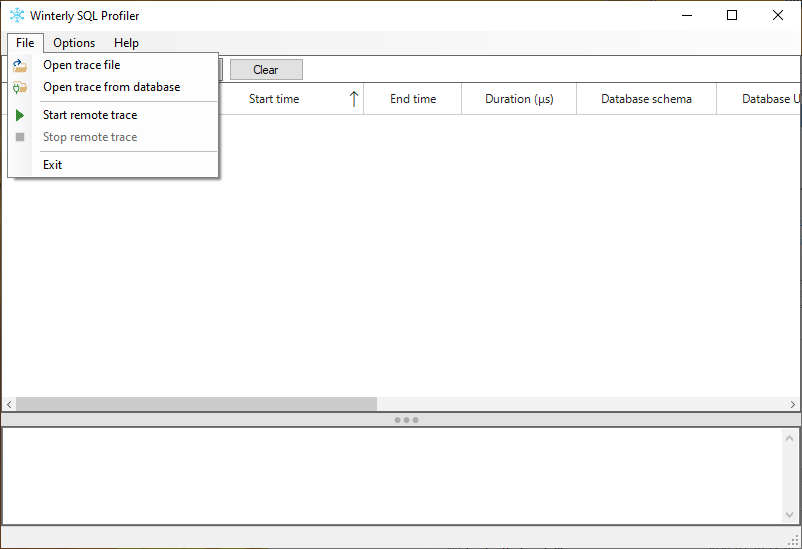
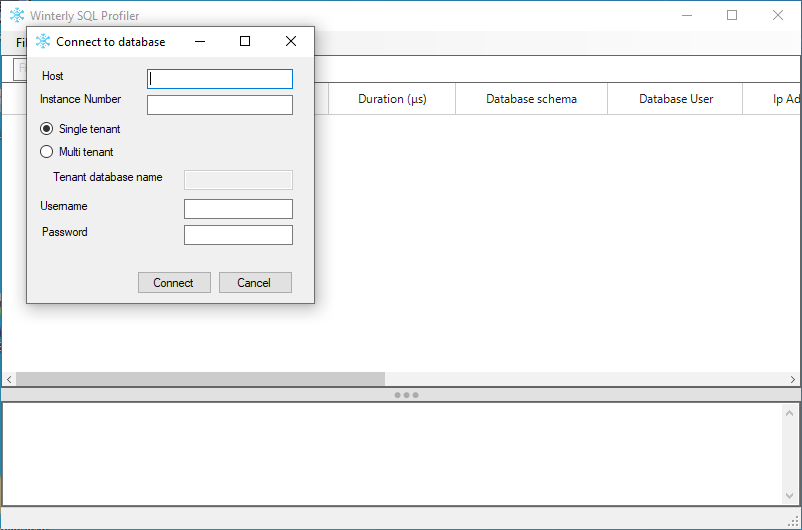
We’ve added the ability to see the sql queries that are run in the database in real-time. Previously, you had to use Hana Studio or Hana Cockpit to start a trace and then download the trace or open it remotely in the Winterly SQL Profiler. With this feature, these steps are not needed anymore as you can do all of this in the profiler.
Under the file menu, two new commands are available : Start and Stop remote trace. Upon using this, the software will ask you to connect to an SAP HANA database and the trace will start. You can see on the bottom right corner the name of the connected hana server.
Please note that tracing in hana is expensive and may affect the performance of the database so you should try to keep the sql trace enabled only for a short period of time.
While the trace is live, you can use any of the filters and sorting functionality of the grid.
Under the Options menu, you can find the Auto scroll item, which is checked by default. When it’s checked, the grid will automatically scroll down to the most recent entries when new entries are added.
To have the live trace feature to work, you need to have installed the 64 bit hana driver on your local computer.
Please note that to start a trace, you will need to use a sql user that has INIFILE ADMIN system privileges. The default SYSTEM sql user has the required permission to start a trace.
Another thing to note, an artificial limitation was added to restrict the trace file size to 100 MiB. This is a protection mechanism to prevent the disk on the hana server to become full and crash the system. After the size limit is reached, the hana database will continue tracing (and this continues to impact performance) but no new sql queries will be shown in the software. At this point, you should simply stop the trace by using the Stop remote trace menu item or exit the profiler.
Other changes :
- Changed the width of the grid columns to better default. These can still be changed manually when needed.
- Added command line parameters to open a trace file from disk, open a trace remotely from a database and start a trace in real-time in the database. Start the program with –help through a console window to see the details. The SQL Profiler still allows you to set it as the default program in Windows as a quick way to open hana trace file.
- The 64 bit hana driver will be used by default instead of the 32 bit driver used previously.
- Added some nice icons to the menu.
- Added functionality to automatically report crashes online.
Fixes :
- Detect if the hana driver is not installed and warn the user with a helpful message.
- In certain cases, the number of errors reported when opening a trace file would be higher because some errors were counted twice.


