Introducing a running total, Groups and new columns like Application and Cursor

Running total

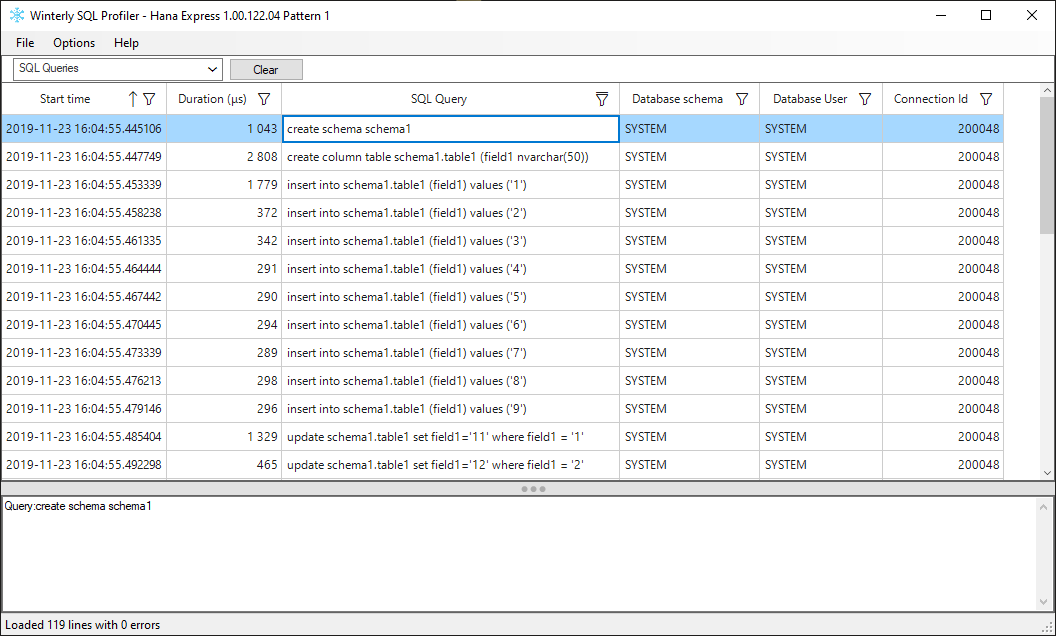
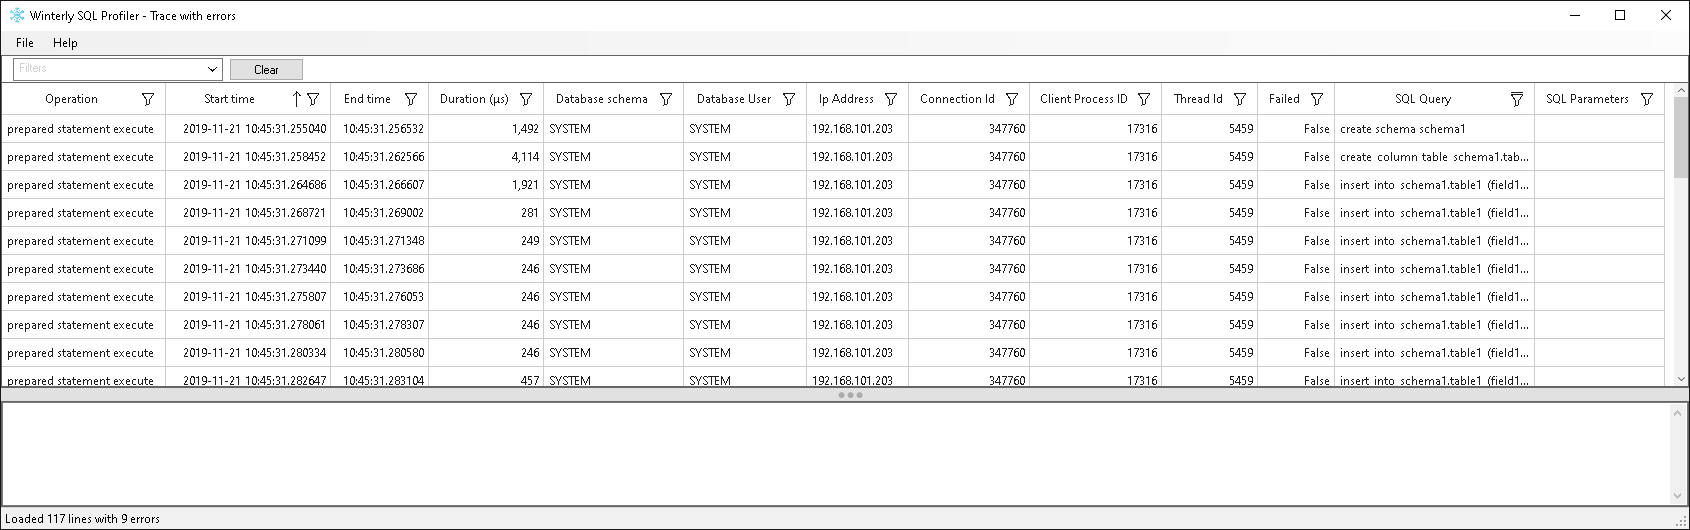
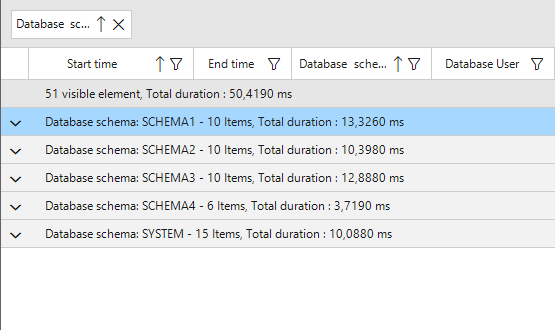
There is now a running total at the top of the grid. This running total shows you how many rows are visible in the grid and the total duration for all those rows. The use case of this running total is to be able to compare the duration and number of rows when applying different filter. When you set a filter in the grid and include or exclude some value, the total gets updated accordingly. For example, you could use this to check the duration of sql queries from a specific application or sql user. This also enables you to manually check the filtered duration / total duration and get a ratio off the duration or number of elements.

Filter by applications

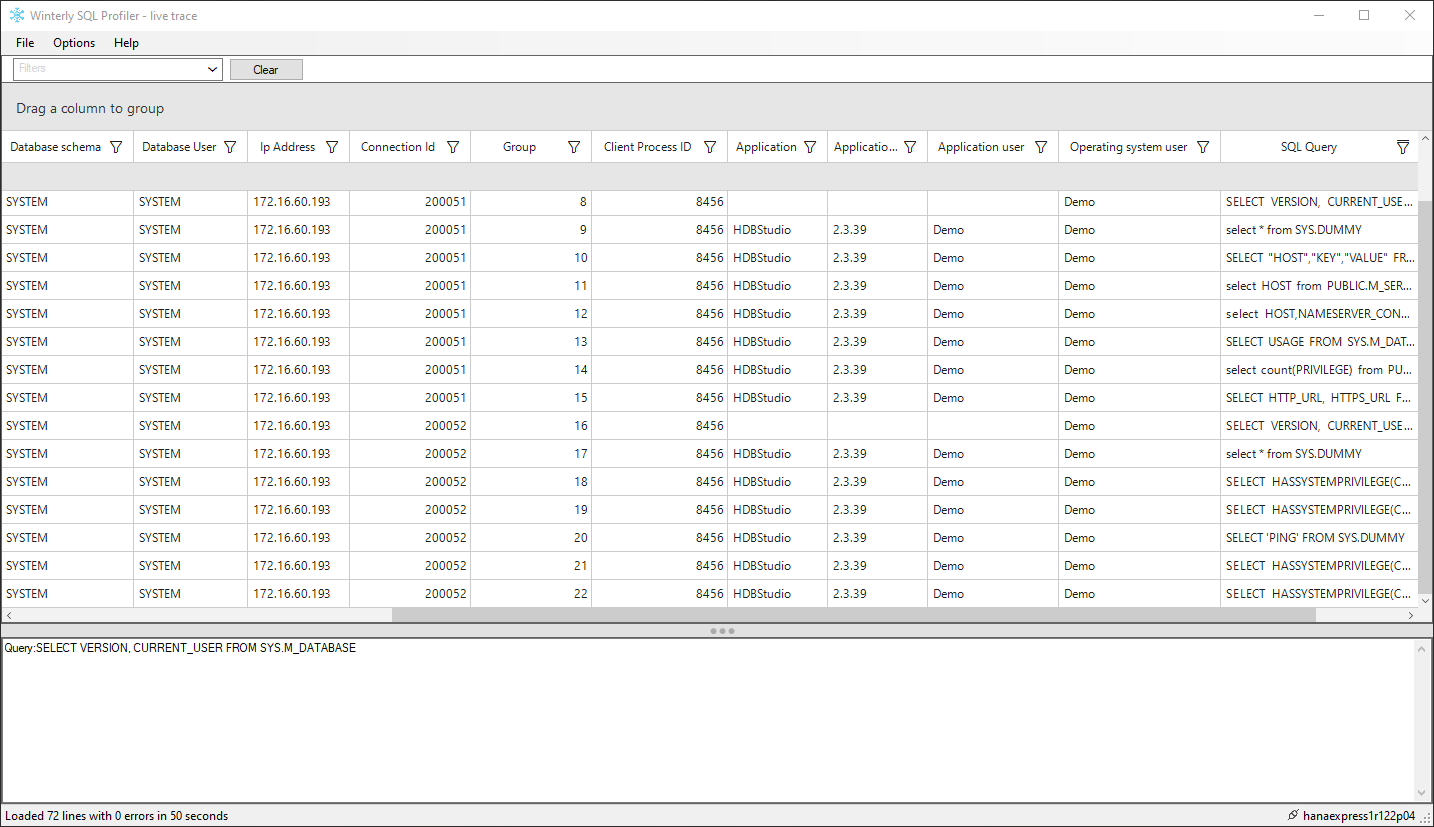
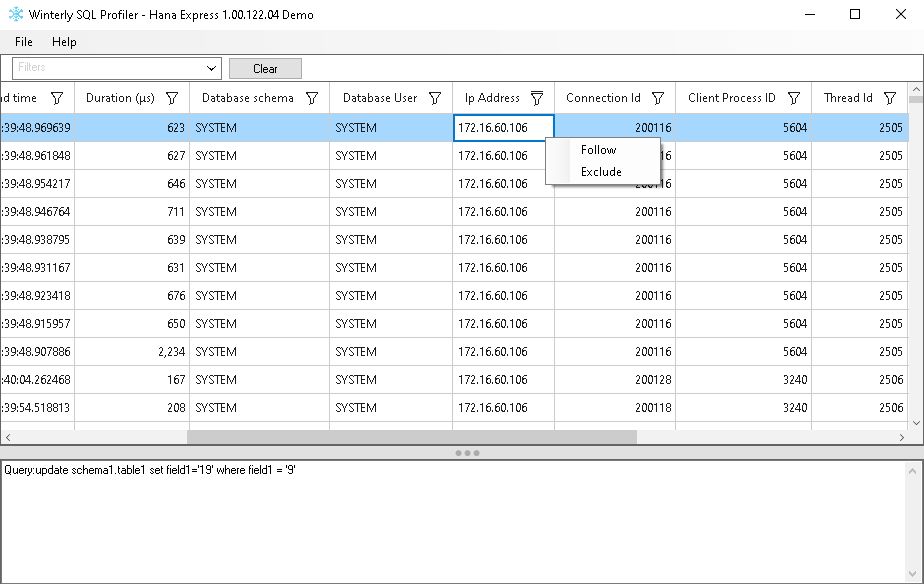
You can now filter by an application. Previously this was possible, but it was much harder. You first had to find a connection id that matched with your application based on either the ip address and process id, sql user or sql queries and the query “set application”. Now, you can directly filter a specific application and then follow it’s queries.

Application name : The application can specify an application name when connecting to the database. If no name is specified, then depending on the technology and programming language of the client application, the file name of the executable may be available as the application name.
Application version : The application can declare to the database which version it is running, and if so it will be visible in this column. Otherwise the column will stay empty.
Application user : Some application might allow multiple users to login. The application can specify for which of its virtual user it connects to the database. For example, in an ERP system, you would be able to see that Bill at the accounting doing sql queries in the grand ledger and Vincent in sales is entering an order in the order forms.
Operating system user : this complements the Ip address and process id columns. It allows you to see the name of the operating system user which is running the software connecting to the hana database. On a personal pc, this will be the windows login you use when starting your computer. On a terminal server, it will be the login you use to connect to the remote server.
For example, If you have a terminal server and multiple users connecting to a hana database through a program, you would be able to see different os user coming from the same ip address.

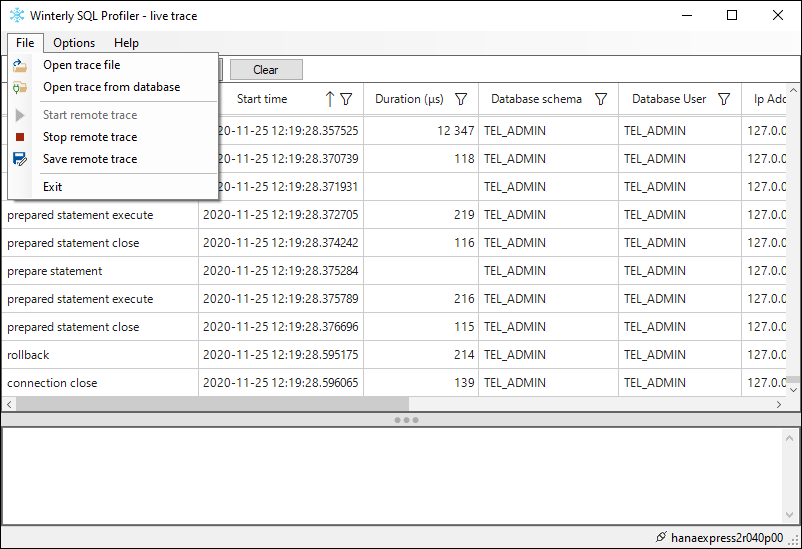
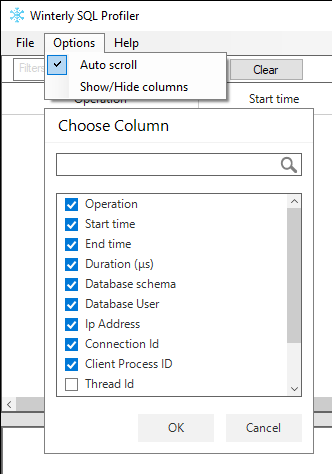
Do note that opening a trace from a previous version of the profiler will not show you these new fields. You need to create a new live trace to be able to see this additional information. By default, only the application name is visible, you can enable the other 3 columns from the menu Options->Show/Hide columns.

Grouping

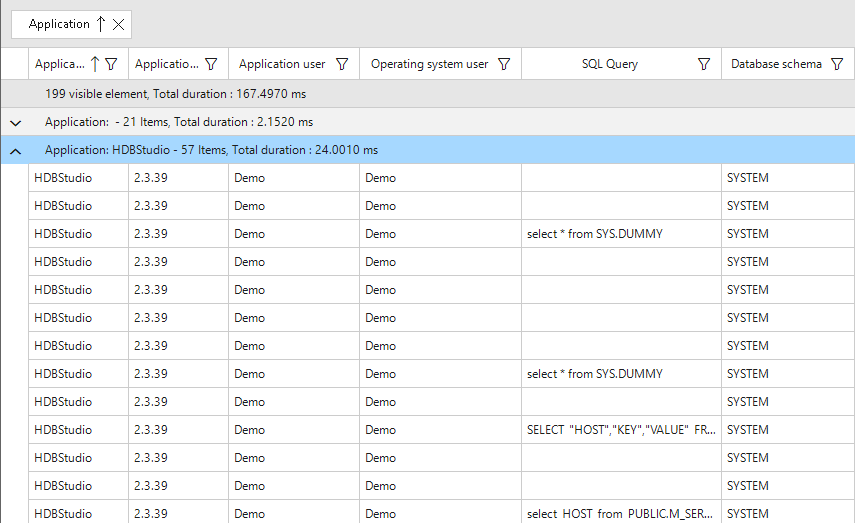
You can now group by any column in the winterly sql profiler for sap hana.
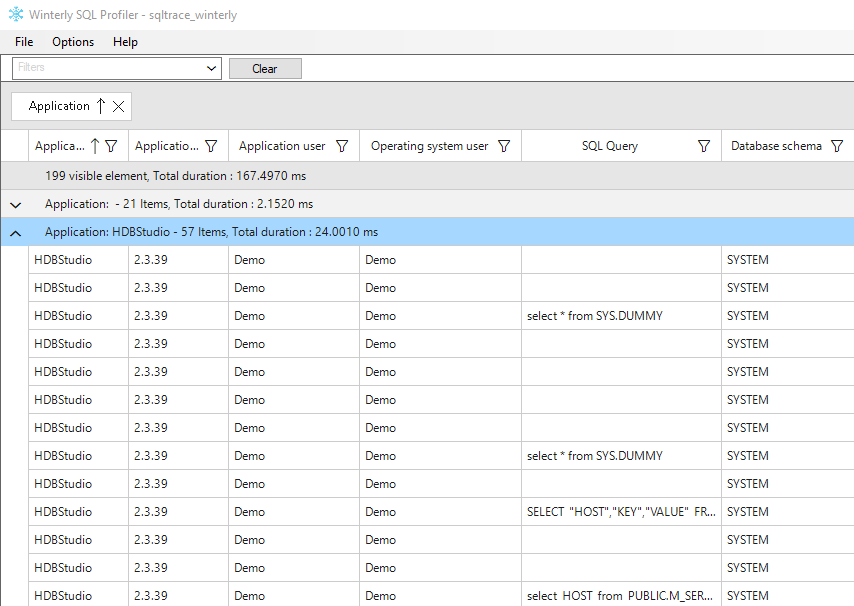
To group a column, simply drag and drop it to the top gray bar. You can toggle the top grouping bar through Options->Allow grouping.

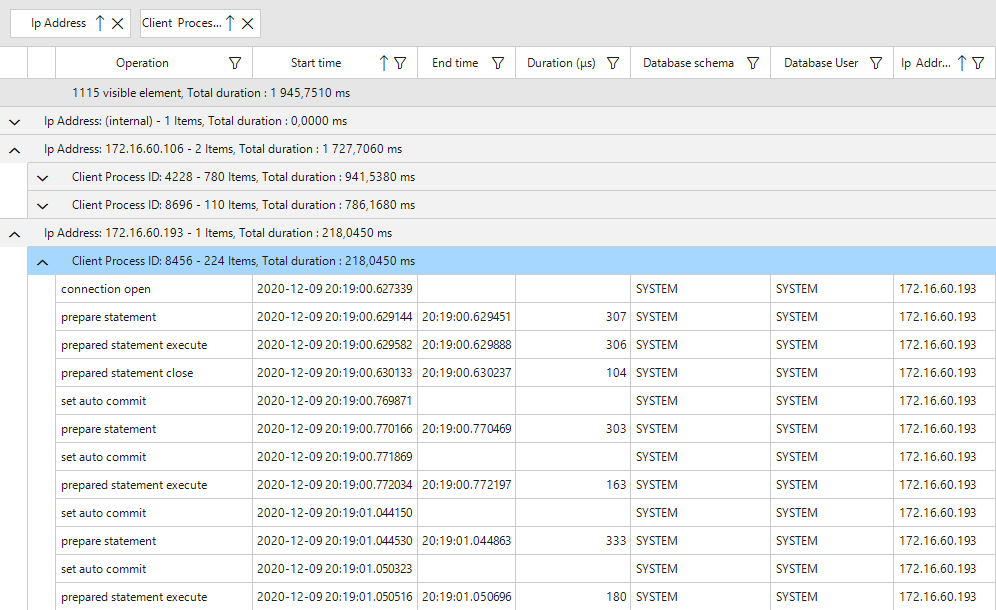
Use this to group by Schema, by connection id and by process id or by application. Multilevel groups are also available. Group and filter to quickly find what you’re looking for. The total duration has also been added to the group title so you can see at a glance which application/user/section used the most the database when the trace was running.

Note that the grid is first filtered, then grouped and only then sorted. Therefore, do know that sorting by start time is only applied to the rows in each group.
Also note that while it’s possible to group in live mode, it’s been disabled by default because of performance issues when running a long trace on a heavily loaded server. Typically, you either want to see queries in live mode (thus without grouping) or you want to analyze a completed trace and use grouping and filtering. If grouping is needed during the live move, you can re-enable it from the Option menu.

Cursor Id and Group column

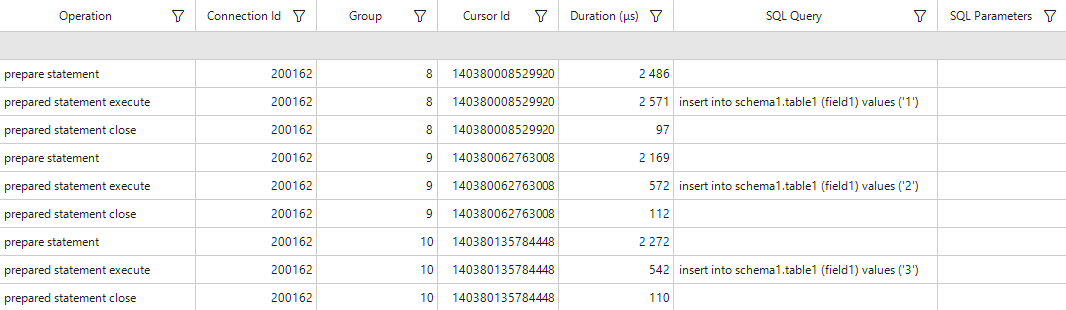
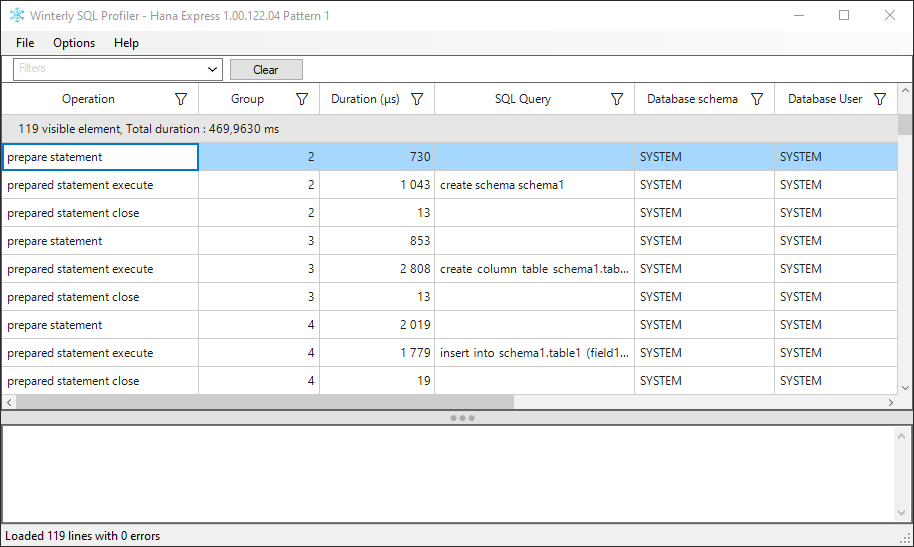
The new fields Group Id and Cursor Id have been added. Their purpose is to link multiple rows together. Having those two allows you to see the usage pattern of your queries.

The cursor id provided by hana is not unique so as to make its usage easier, I created the Group column. It’s basically the same thing, but it’s unique within the trace file. This more accurately reflects cursor usage in the database, as each cursor is really unique.

What is a cursor ? A cursor is created on the database side for each new query that an application creates. For example, in the below code example in C#, a database cursor will be created.

System.Data.Common.DbCommand cmd = connection.CreateCommand();
cmd.CommandText = "select * from dummy";
cmd.ExecuteNonQuery();

Depending on how your application access to the database, one or more cursor could be created for the same query. This code example below will produce this output in the profiler.

System.Data.Common.DbCommand cmd = connection.CreateCommand();
cmd.CommandText = "select * from dummy";
//This will create 2 cursor
cmd.ExecuteNonQuery();

System.Data.Common.DbCommand cmd2 = connection.CreateCommand();
cmd2.CommandText = "select * from dummy";
//This will create yet another cursor
cmd2.ExecuteNonQuery();


System.Data.Common.DbCommand cmd3 = connection.CreateCommand();
cmd3.CommandText = "select * from dummy";
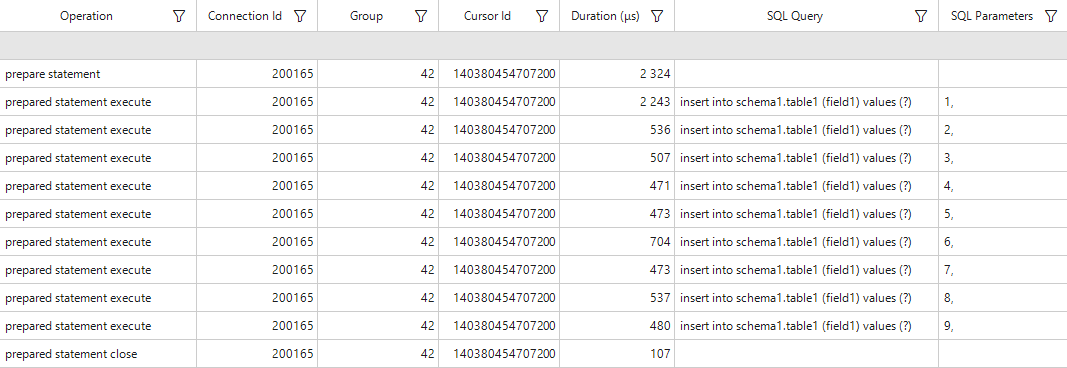
//By using prepare, the cursor will be created once and reused
cmd3.Prepare();
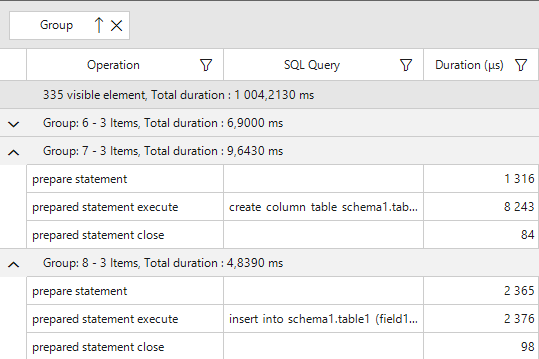
cmd3.ExecuteNonQuery();

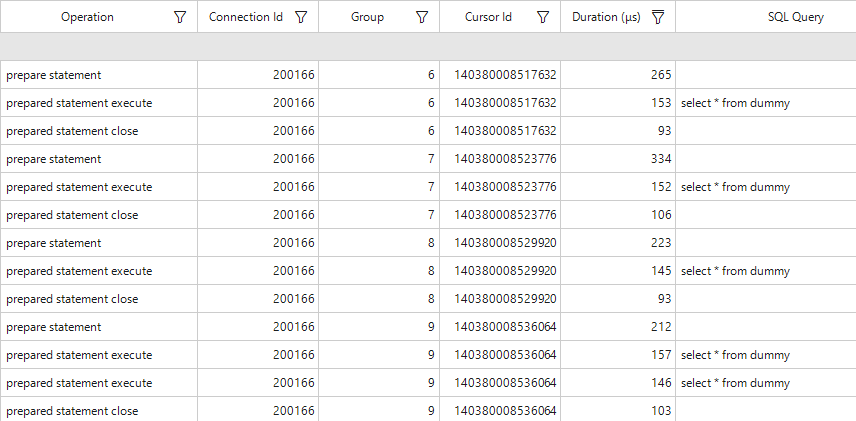
In the above picture, group 6 and 7 belongs to cmd, 8 belongs to cmd2 and 9 belongs to cmd3.

This subject is pretty technical and it might be very hard to properly explain in a few sentences in this blog post. For those that would like to understand more about this topic, I would recommend to watch a presentation from sap, Understanding SAP HANA Database Performance which will guide you through the various operations (cursor created, prepared, executed, closed), the sql plan cache, sql parameter and other subjects.

Misc

  • When copying from the grid to the clipboard with Ctrl-C, instead of retrieving the whole row, only the selected cell will be put in the clipboard.
  • Fixed : infrequently, a row can be hidden from the grid when the profiler is running in live mode and there is a very heavy load on the database.

Here are the changes released in the newest version of the Winterly SQL Profiler :

Download traces

You can now download SAP HANA sql traces directly from the SQL Profiler. This is useful if you want to keep a trace and inspect it at a later date, or compare the performance of an application between servers or between versions.

If you want to save a copy of the current or last live trace, you can do so using the “Save remote trace” button in the main menu. You can also download an older trace from the database in the “Open trace from database” screen. The screen now shows the file size, as a trace on Hana can become big quite fast. If you plan to keep them for a long time, it’s recommended to put them inside an archive as it will reduce the size to roughly 7%.

Show and hide columns

A new button “Show/Hide columns” has been added under the Options menu. It allows you to hide the columns that you don’t want to use and focus on the rest of the columns. We’ve also hid the Thread id column by default, as it’s not needed very often.

New command line switch

A new command line operation has been added “database-information”.
Previously, you could :

  • Associate Hana trace file (*.py) with the Winterly SQL Profiler so that double-clicking on the file would open it in the profiler.
  • Open a local trace
  • Start a live trace on a hana server
  • Open a trace file remotely from a hana database

Both the open-database and trace-database asked you for connection information in command line argument to automate the task.
You can now use the “database-information” command to specify the information but without starting any action. This can be useful to create a shortcut of the profiler to a specific server. The password is now optional for all the operations, and will be asked in the graphical user interface if missing. This is more secure than saving the password in clear text in a shortcut or a script file. You can otherwise use a password manager CLI tool to retrieve securely a password for use in a script file.

Here is the preview of the main help that you get when you launch the program with -? -h or –help from a shell.

9.0.0.0

Usage: SQLProfiler.exe [command] [options]

Options:
  --version             Show version information
  -?|-h|--help          Show help information

Commands:
  database-information  Specify the connection information to the database, but
                        do not start a trace or open a remote file.
  open-database         Open a hana sql trace file from a remote server
  open-file             Open a hana sql trace file from the disk
  trace-database        Start a sql trace on a remote server

Run 'SQLProfiler.exe [command] -?|-h|--help' for more information about a command.

Miscellaneous

When connecting to the database, the profiler registers it’s application name, so that if you inspect open connections in hana cockpit or hana studio, you will be able to quickly identify which belongs to this software.

Fixes

  • SQL queries that contain single quote ‘ or backslash \ were not properly shown in the Winterly SQL Profiler for SAP HANA.
  • Some SQL queries containing a mix of single quote, backslash and parenthesis could not be parsed and would crash the application.
  • SQL queries with special characters like Japanese, Arabic, or French accents were not properly shown.

Version 8.2

This is a bugfix release on top of the previous version. Here are the fixes that were done :

  • When tracing in real-time, disable the auto-scroll if a custom sorting is used on any columns. Auto-scroll basically scroll to bottom to always show the latest queries when the grid is sorted by time ascending, but if you’re sorting by any other columns this behaviour is unneeded and needed to be manually disabled in the previous version through the menu.
  • Small popup windows, like about, open trace from database and the form that request the connection information now cannot be minimized – they can only be closed to confirm or cancel the action.
  • When processing the trace data, sql parameters for the field type varchar and nvarchar with a value containing only a comma failed to be properly parsed. This version properly supports these sql queries.

We’ve added the ability to see the sql queries that are run in the database in real-time. Previously, you had to use Hana Studio or Hana Cockpit to start a trace and then download the trace or open it remotely in the Winterly SQL Profiler. With this feature, these steps are not needed anymore as you can do all of this in the profiler.

Under the file menu, two new commands are available : Start and Stop remote trace. Upon using this, the software will ask you to connect to an SAP HANA database and the trace will start. You can see on the bottom right corner the name of the connected hana server.
Please note that tracing in hana is expensive and may affect the performance of the database so you should try to keep the sql trace enabled only for a short period of time.

While the trace is live, you can use any of the filters and sorting functionality of the grid.
Under the Options menu, you can find the Auto scroll item, which is checked by default. When it’s checked, the grid will automatically scroll down to the most recent entries when new entries are added.

To have the live trace feature to work, you need to have installed the 64 bit hana driver on your local computer.
Please note that to start a trace, you will need to use a sql user that has INIFILE ADMIN system privileges. The default SYSTEM sql user has the required permission to start a trace.

Another thing to note, an artificial limitation was added to restrict the trace file size to 100 MiB. This is a protection mechanism to prevent the disk on the hana server to become full and crash the system. After the size limit is reached, the hana database will continue tracing (and this continues to impact performance) but no new sql queries will be shown in the software. At this point, you should simply stop the trace by using the Stop remote trace menu item or exit the profiler.

Other changes :

  • Changed the width of the grid columns to better default. These can still be changed manually when needed.
  • Added command line parameters to open a trace file from disk, open a trace remotely from a database and start a trace in real-time in the database. Start the program with –help through a console window to see the details. The SQL Profiler still allows you to set it as the default program in Windows as a quick way to open hana trace file.
  • The 64 bit hana driver will be used by default instead of the 32 bit driver used previously.
  • Added some nice icons to the menu.
  • Added functionality to automatically report crashes online.

Fixes :

  • Detect if the hana driver is not installed and warn the user with a helpful message.
  • In certain cases, the number of errors reported when opening a trace file would be higher because some errors were counted twice.

Version 7.0

Version 7.0 of the Winterly SQL Profiler has been released.

Changes :

  • Added the ability to open a trace file from the database. More details below.
  • Improved parsing speed of trace files.

Fixes:

  • Better handling of Hana 1.0 SP10 trace file with statement exception instruction. In this older version of hana, the trace file contained the sql query that failed, but did not contain the helpful error message generated by the database and returned to the calling application.

This version is a partial release between the previous version which only supported offline file, and a future version that will allow real-time view of sql statement executed in the database. The current version still requires you to start, stop and delete the trace with an external application. This point release allows you to open a remote trace file, but the data shown will not change over time even if the trace is still running.

From the File menu, a new entry was added “Open trace from database”. Upon using this, the software will ask you to connect to an SAP HANA database. Note that on multi-tenant system, you cannot select the SYSTEMDB, as this tenant/database is only used for the management of other tenant/database, and will not be used to host and run any application nor sql trace. After you’ve entered the connection information, a screen listing the available trace will open and you will be able to select the trace you want to view.

For this feature to work, you need to have installed the 64bit hana driver on your local computer.
Also, to be able to open a sql trace from the database, the sql user you use to connect must have one of those permission : the MONITORING role, CATALOG_READ system privilege, INIFILE ADMIN system privilege or the DATA ADMIN system privilege. The SYSTEM user has those privileges. If you’re running Business One on Hana, the sql user used for the installation of B1 will also have the required privileges.

Version 6.0

Changes :

  • You can now set the Winterly SQL Profiler as the default software to open HANA .py files. The program will automatically open the trace file that you double clicked after startup.
  • If there is an error while parsing a trace file, the Profiler will try to continue loading the file and show what was successfully parsed. You will see in the bottom left of the screen the number parsed lines and the number of errors in the current file.
Show the parsing status at the bottom left of the software
  • Added link to the website and this changelog in the about page.

Fixes :

  • Clear the filter when opening a new file or clearing the view.
  • Large SQL parameter list with more than 30 000 characters could crash the software. We will limit the grid to show only the first 100 characters of the parameter list. The full value can still be filtered through the grid and shown in the bottom pane.
  • Changed how SQL Parameters are shown in the grid and in the bottom pane :
    • Removed the duplicated ”’ delimiters that were previously shown for text values.
    • Corrected single quote inside a text value to be displayed correctly.

Version 5.1

Fixes:

  • Properly log out of the license server if the software close unexpectedly because of an error.
  • Properly log out of the license server if the user logout from windows.
  • Internal changes.

Version 5.0

Fixes:

  • Fixed issue with trace file from SAP HANA version 122.16. The trace had a slightly different connection id scheme than other 122.16 examples preventing to properly group related operations together. Simplified the connection id matching for all versions to make it more robust.

Version 4.0

Changes:

  • Added support email in about page

Fixes:

  • Fixed issue with trace file from SAP HANA version 122.21. The trace had a slightly different connection id scheme preventing to properly group related operations together.

Version 3.0

Changes:

  • Added 2 right-click options on the grid : Follow and Exclude. These are quick action to filter rows shown in the grid. You can still use the column header to set advanced conditions to filter.
    • Follow will filter the grid to only show rows that match the selected value.
    • Exclude will hide all rows that do not match the selected value.

This feature makes it more quicker to apply filters to the grid than using the column filter button. As you go in the trace, it allows you to painlessly follow multiple connection and application at the same time and hide the unrelated connection. You keep full visibility of what you want and exclude what you don’t.

  • Improved previous version handling of very big sql query to allow the filter to work on the full query. The query shown in the grid will still be limited, but this is a non issue since it can be seen fully in the bottom pane.

Fixes:

  • On the grid, time could be shown differently depending on the culture of each computer. Some computer show am/pm in their time format and this would conflict with the grid trying to show microseconds. The time format was changed to use the iso 8601 standard at all time with 24 hours clock and microseconds in the format hh:mm:ss.ffffff.
  • Error statements from multi-line sql queries were not correctly parsed. They are now correctly shown in the grid with the full error message.