Here are the changes released in the newest version of the Winterly SQL Profiler :
Download traces
You can now download SAP HANA sql traces directly from the SQL Profiler. This is useful if you want to keep a trace and inspect it at a later date, or compare the performance of an application between servers or between versions.
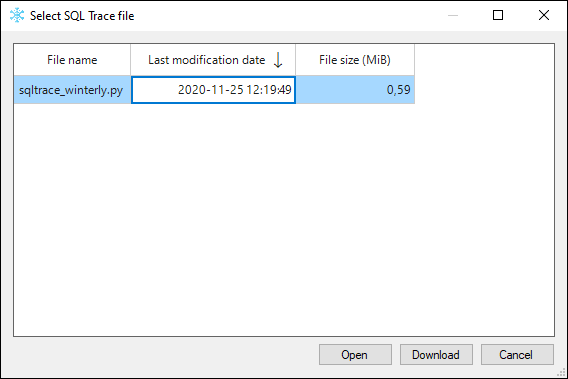
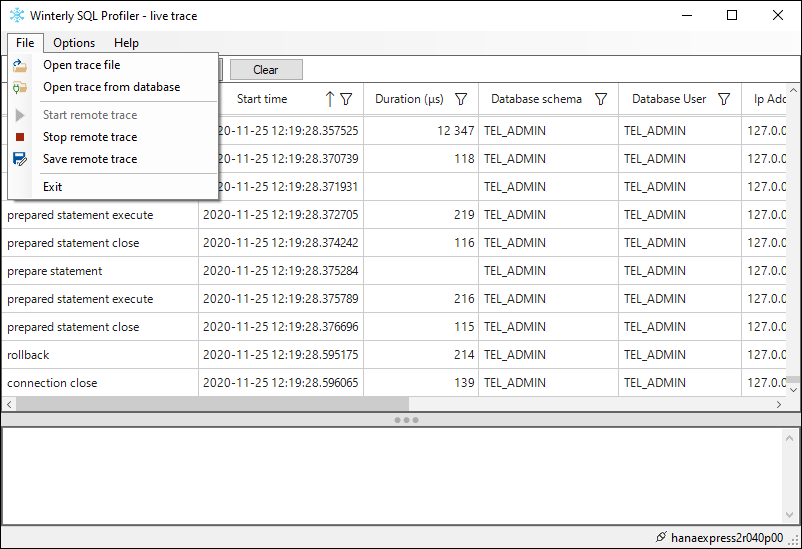
If you want to save a copy of the current or last live trace, you can do so using the “Save remote trace” button in the main menu. You can also download an older trace from the database in the “Open trace from database” screen. The screen now shows the file size, as a trace on Hana can become big quite fast. If you plan to keep them for a long time, it’s recommended to put them inside an archive as it will reduce the size to roughly 7%.
Show and hide columns
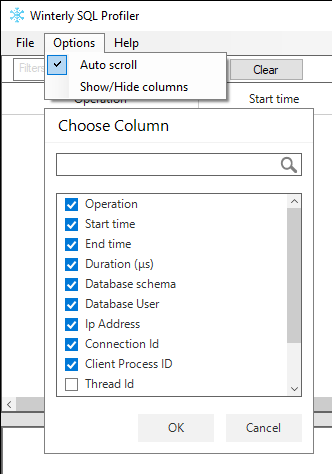
A new button “Show/Hide columns” has been added under the Options menu. It allows you to hide the columns that you don’t want to use and focus on the rest of the columns. We’ve also hid the Thread id column by default, as it’s not needed very often.
New command line switch
A new command line operation has been added “database-information”.
Previously, you could :
- Associate Hana trace file (*.py) with the Winterly SQL Profiler so that double-clicking on the file would open it in the profiler.
- Open a local trace
- Start a live trace on a hana server
- Open a trace file remotely from a hana database
Both the open-database and trace-database asked you for connection information in command line argument to automate the task.
You can now use the “database-information” command to specify the information but without starting any action. This can be useful to create a shortcut of the profiler to a specific server. The password is now optional for all the operations, and will be asked in the graphical user interface if missing. This is more secure than saving the password in clear text in a shortcut or a script file. You can otherwise use a password manager CLI tool to retrieve securely a password for use in a script file.
Here is the preview of the main help that you get when you launch the program with -? -h or –help from a shell.
9.0.0.0

Usage: SQLProfiler.exe [command] [options]

Options:
  --version             Show version information
  -?|-h|--help          Show help information

Commands:
  database-information  Specify the connection information to the database, but
                        do not start a trace or open a remote file.
  open-database         Open a hana sql trace file from a remote server
  open-file             Open a hana sql trace file from the disk
  trace-database        Start a sql trace on a remote server

Run 'SQLProfiler.exe [command] -?|-h|--help' for more information about a command.
Miscellaneous
When connecting to the database, the profiler registers it’s application name, so that if you inspect open connections in hana cockpit or hana studio, you will be able to quickly identify which belongs to this software.
Fixes
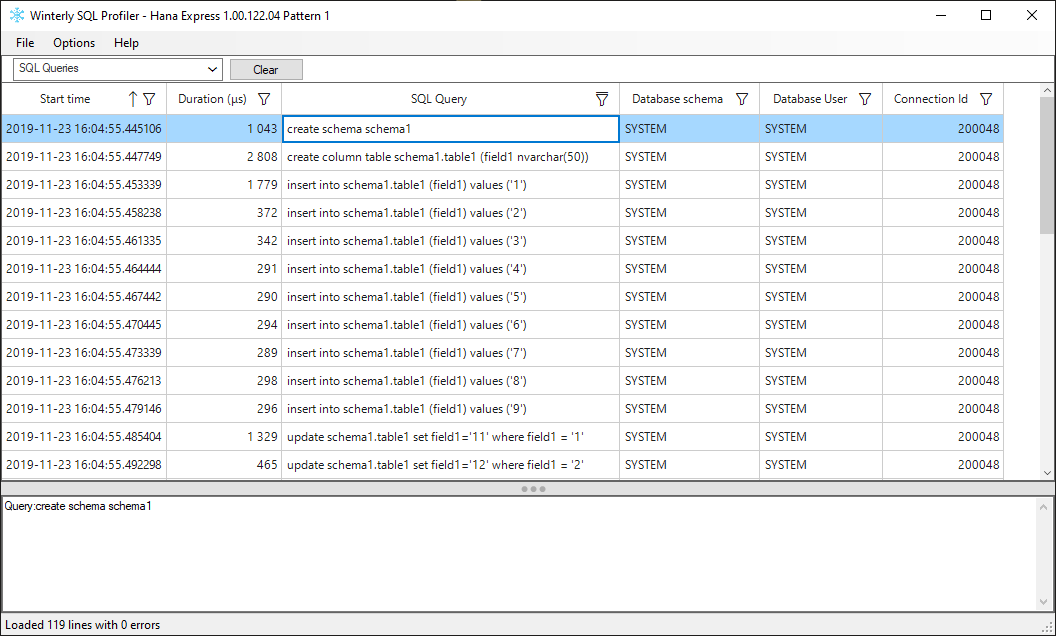
- SQL queries that contain single quote ‘ or backslash \ were not properly shown in the Winterly SQL Profiler for SAP HANA.
- Some SQL queries containing a mix of single quote, backslash and parenthesis could not be parsed and would crash the application.
- SQL queries with special characters like Japanese, Arabic, or French accents were not properly shown.