Introducing a running total, Groups and new columns like Application and Cursor
Running total
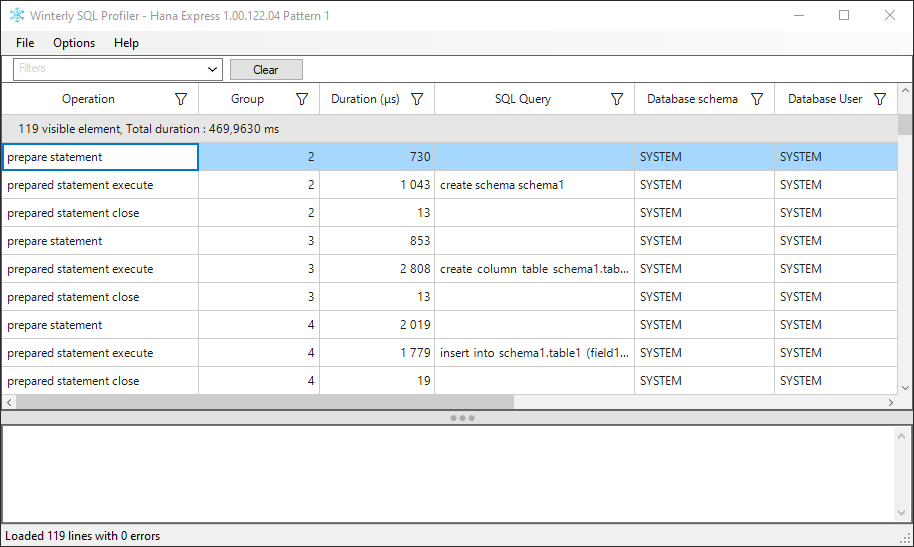
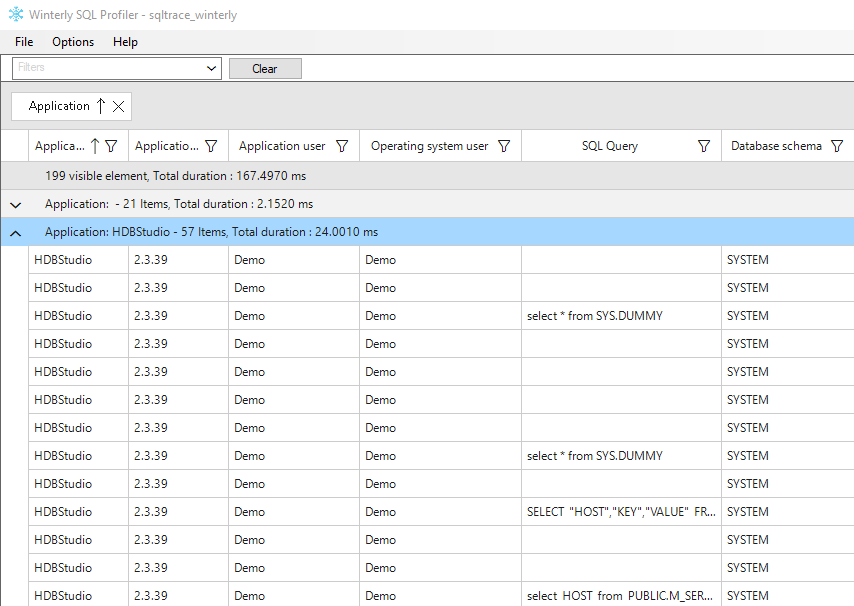
There is now a running total at the top of the grid. This running total shows you how many rows are visible in the grid and the total duration for all those rows. The use case of this running total is to be able to compare the duration and number of rows when applying different filter. When you set a filter in the grid and include or exclude some value, the total gets updated accordingly. For example, you could use this to check the duration of sql queries from a specific application or sql user. This also enables you to manually check the filtered duration / total duration and get a ratio off the duration or number of elements.
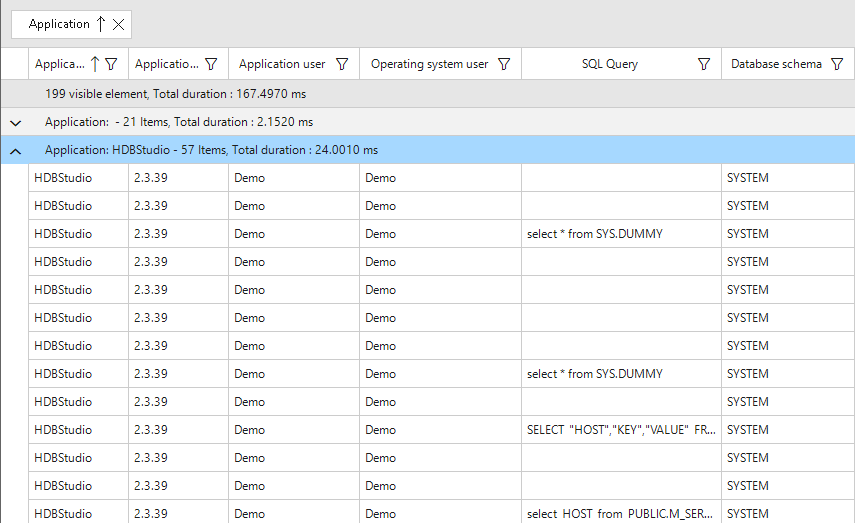
Filter by applications
You can now filter by an application. Previously this was possible, but it was much harder. You first had to find a connection id that matched with your application based on either the ip address and process id, sql user or sql queries and the query “set application”. Now, you can directly filter a specific application and then follow it’s queries.
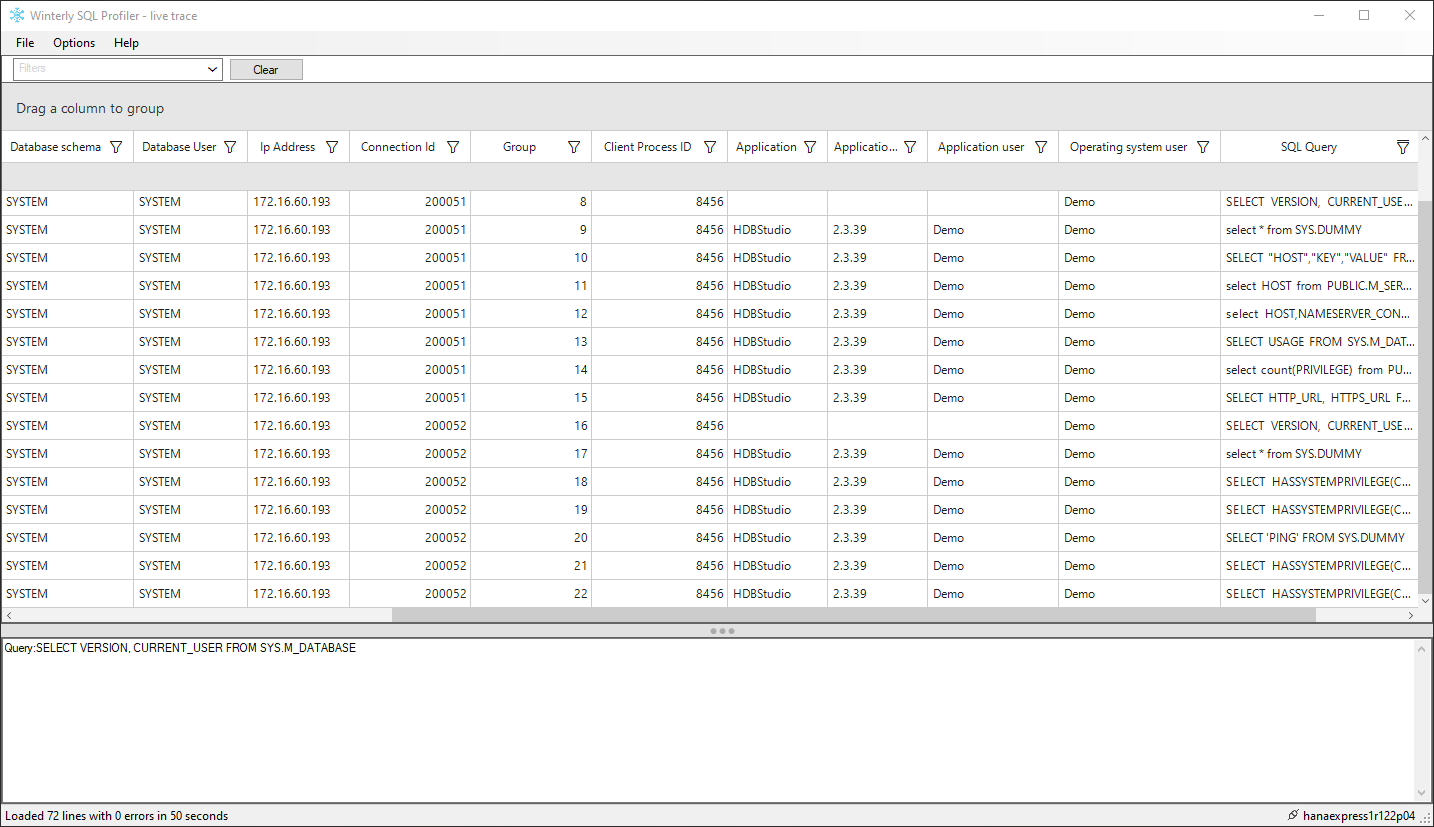
Application name : The application can specify an application name when connecting to the database. If no name is specified, then depending on the technology and programming language of the client application, the file name of the executable may be available as the application name.
Application version : The application can declare to the database which version it is running, and if so it will be visible in this column. Otherwise the column will stay empty.
Application user : Some application might allow multiple users to login. The application can specify for which of its virtual user it connects to the database. For example, in an ERP system, you would be able to see that Bill at the accounting doing sql queries in the grand ledger and Vincent in sales is entering an order in the order forms.
Operating system user : this complements the Ip address and process id columns. It allows you to see the name of the operating system user which is running the software connecting to the hana database. On a personal pc, this will be the windows login you use when starting your computer. On a terminal server, it will be the login you use to connect to the remote server.
For example, If you have a terminal server and multiple users connecting to a hana database through a program, you would be able to see different os user coming from the same ip address.
Do note that opening a trace from a previous version of the profiler will not show you these new fields. You need to create a new live trace to be able to see this additional information. By default, only the application name is visible, you can enable the other 3 columns from the menu Options->Show/Hide columns.
Grouping
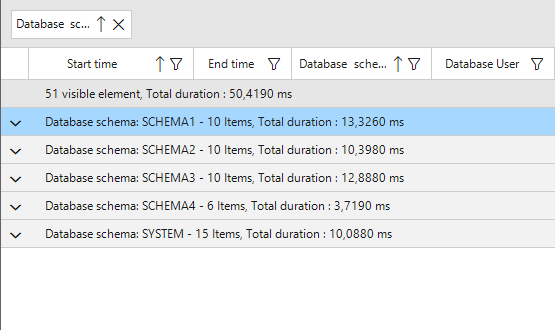
You can now group by any column in the winterly sql profiler for sap hana.
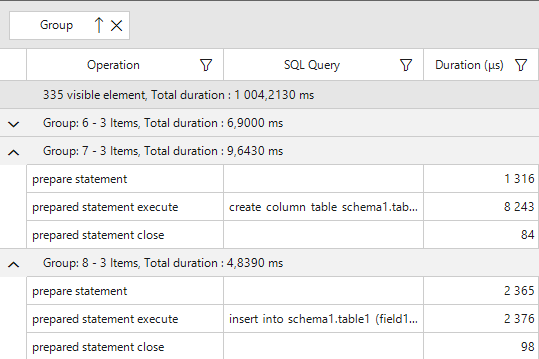
To group a column, simply drag and drop it to the top gray bar. You can toggle the top grouping bar through Options->Allow grouping.
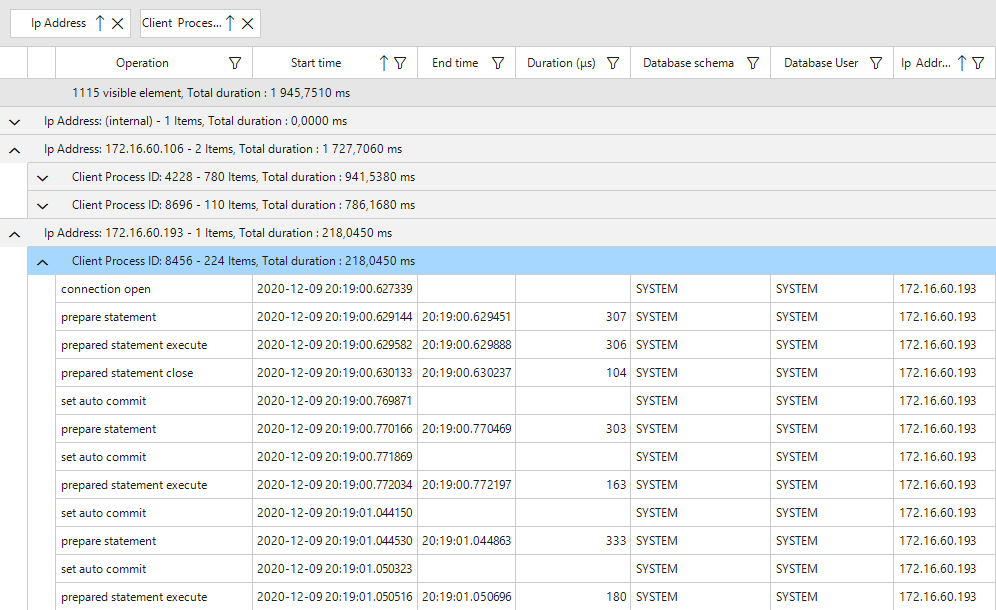
Use this to group by Schema, by connection id and by process id or by application. Multilevel groups are also available. Group and filter to quickly find what you’re looking for. The total duration has also been added to the group title so you can see at a glance which application/user/section used the most the database when the trace was running.
Note that the grid is first filtered, then grouped and only then sorted. Therefore, do know that sorting by start time is only applied to the rows in each group.
Also note that while it’s possible to group in live mode, it’s been disabled by default because of performance issues when running a long trace on a heavily loaded server. Typically, you either want to see queries in live mode (thus without grouping) or you want to analyze a completed trace and use grouping and filtering. If grouping is needed during the live move, you can re-enable it from the Option menu.
Cursor Id and Group column
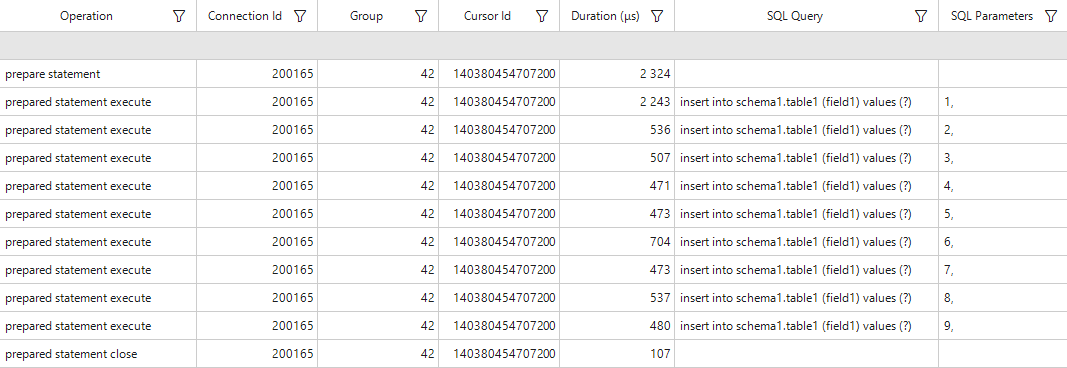
The new fields Group Id and Cursor Id have been added. Their purpose is to link multiple rows together. Having those two allows you to see the usage pattern of your queries.
The cursor id provided by hana is not unique so as to make its usage easier, I created the Group column. It’s basically the same thing, but it’s unique within the trace file. This more accurately reflects cursor usage in the database, as each cursor is really unique.
What is a cursor ? A cursor is created on the database side for each new query that an application creates. For example, in the below code example in C#, a database cursor will be created.
System.Data.Common.DbCommand cmd = connection.CreateCommand();
cmd.CommandText = "select * from dummy";
cmd.ExecuteNonQuery();
Depending on how your application access to the database, one or more cursor could be created for the same query. This code example below will produce this output in the profiler.
System.Data.Common.DbCommand cmd = connection.CreateCommand();
cmd.CommandText = "select * from dummy";
//This will create 2 cursor
cmd.ExecuteNonQuery();
cmd.ExecuteNonQuery();

System.Data.Common.DbCommand cmd2 = connection.CreateCommand();
cmd2.CommandText = "select * from dummy";
//This will create yet another cursor
cmd2.ExecuteNonQuery();


System.Data.Common.DbCommand cmd3 = connection.CreateCommand();
cmd3.CommandText = "select * from dummy";
//By using prepare, the cursor will be created once and reused
cmd3.Prepare();
cmd3.ExecuteNonQuery();
cmd3.ExecuteNonQuery();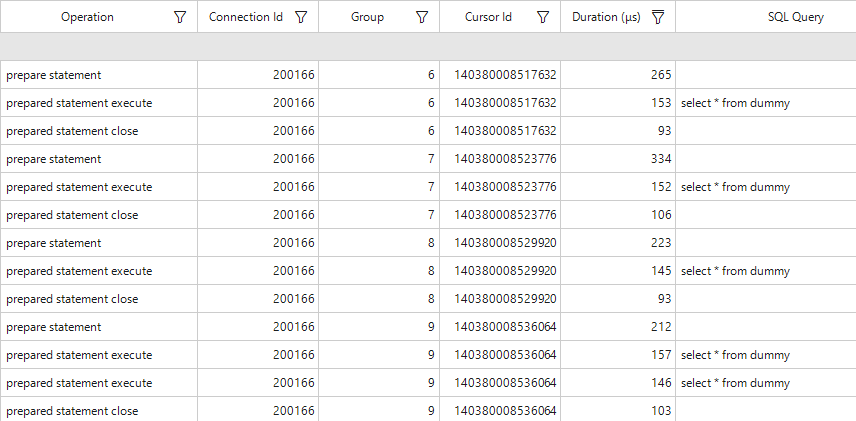
In the above picture, group 6 and 7 belongs to cmd, 8 belongs to cmd2 and 9 belongs to cmd3.
This subject is pretty technical and it might be very hard to properly explain in a few sentences in this blog post. For those that would like to understand more about this topic, I would recommend to watch a presentation from sap, Understanding SAP HANA Database Performance which will guide you through the various operations (cursor created, prepared, executed, closed), the sql plan cache, sql parameter and other subjects.
Misc
- When copying from the grid to the clipboard with Ctrl-C, instead of retrieving the whole row, only the selected cell will be put in the clipboard.
- Fixed : infrequently, a row can be hidden from the grid when the profiler is running in live mode and there is a very heavy load on the database.

